ABO O blood group as a risk factor for platelet reactivity in heparin-induced thrombocytopenia
Abstract
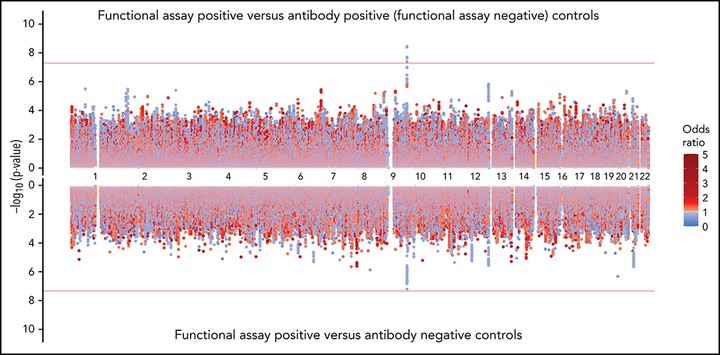
Heparin-induced thrombocytopenia (HIT) is an unpredictable, potentially catastrophic adverse effect resulting from an immune response to platelet factor 4 (PF4)/heparin complexes. We performed a genome-wide association study (GWAS) with positive functional assay as the outcome in a large discovery cohort of patients divided into 3 groups: (1) functional assay-positive cases (n = 1269), (2) antibody-positive (functional assay-negative) controls (n = 1131), and (3) antibody-negative controls (n = 1766). Significant associations (α = 5 × 10⁻⁸) were investigated in a replication cohort (α = 0.05) of functional assay-confirmed HIT cases (n = 177), antibody-positive (function assay-negative) controls (n = 258), and antibody-negative controls (n = 351). We observed a strong association for positive functional assay with increasing PF4/heparin immunoglobulin-G (IgG) level (odds ratio [OR], 16.53; 95% confidence interval [CI], 13.83-19.74; P = 1.51 × 10−209) and female sex (OR, 1.15; 95% CI, 1.01-1.32; P = .034). The rs8176719 C insertion variant in ABO was significantly associated with positive functional assay status in the discovery cohort (frequency = 0.41; OR, 0.751; 95% CI, 0.682-0.828; P = 7.80 × 10⁻⁹) and in the replication cohort (OR, 0.467; 95% CI, 0.228-0.954; P = .0367). The rs8176719 C insertion, which encodes all non-O blood group alleles, had a protective effect, indicating that the rs8176719 C deletion and the O blood group were risk factors for HIT (O blood group OR, 1.42; 95% CI, 1.26-1.61; P = 3.09 × 10⁻⁸). Meta-analyses indicated that the ABO association was independent of PF4/heparin IgG levels and was stronger when functional assay-positive cases were compared with antibody-positive (functional assay-negative) controls than with antibody-negative controls. Sequencing and fine-mapping of ABO demonstrated that rs8176719 was the causal single nucleotide polymorphism (SNP). Our results clarify the biology underlying HIT pathogenesis with ramifications for prediction and may have important implications for related conditions, such as vaccine-induced thrombotic thrombocytopenia.
My Contribution
I’m super proud of the figures that went into this manuscript. The below and featured figures are both my original renditions of popular plots using ggplot2
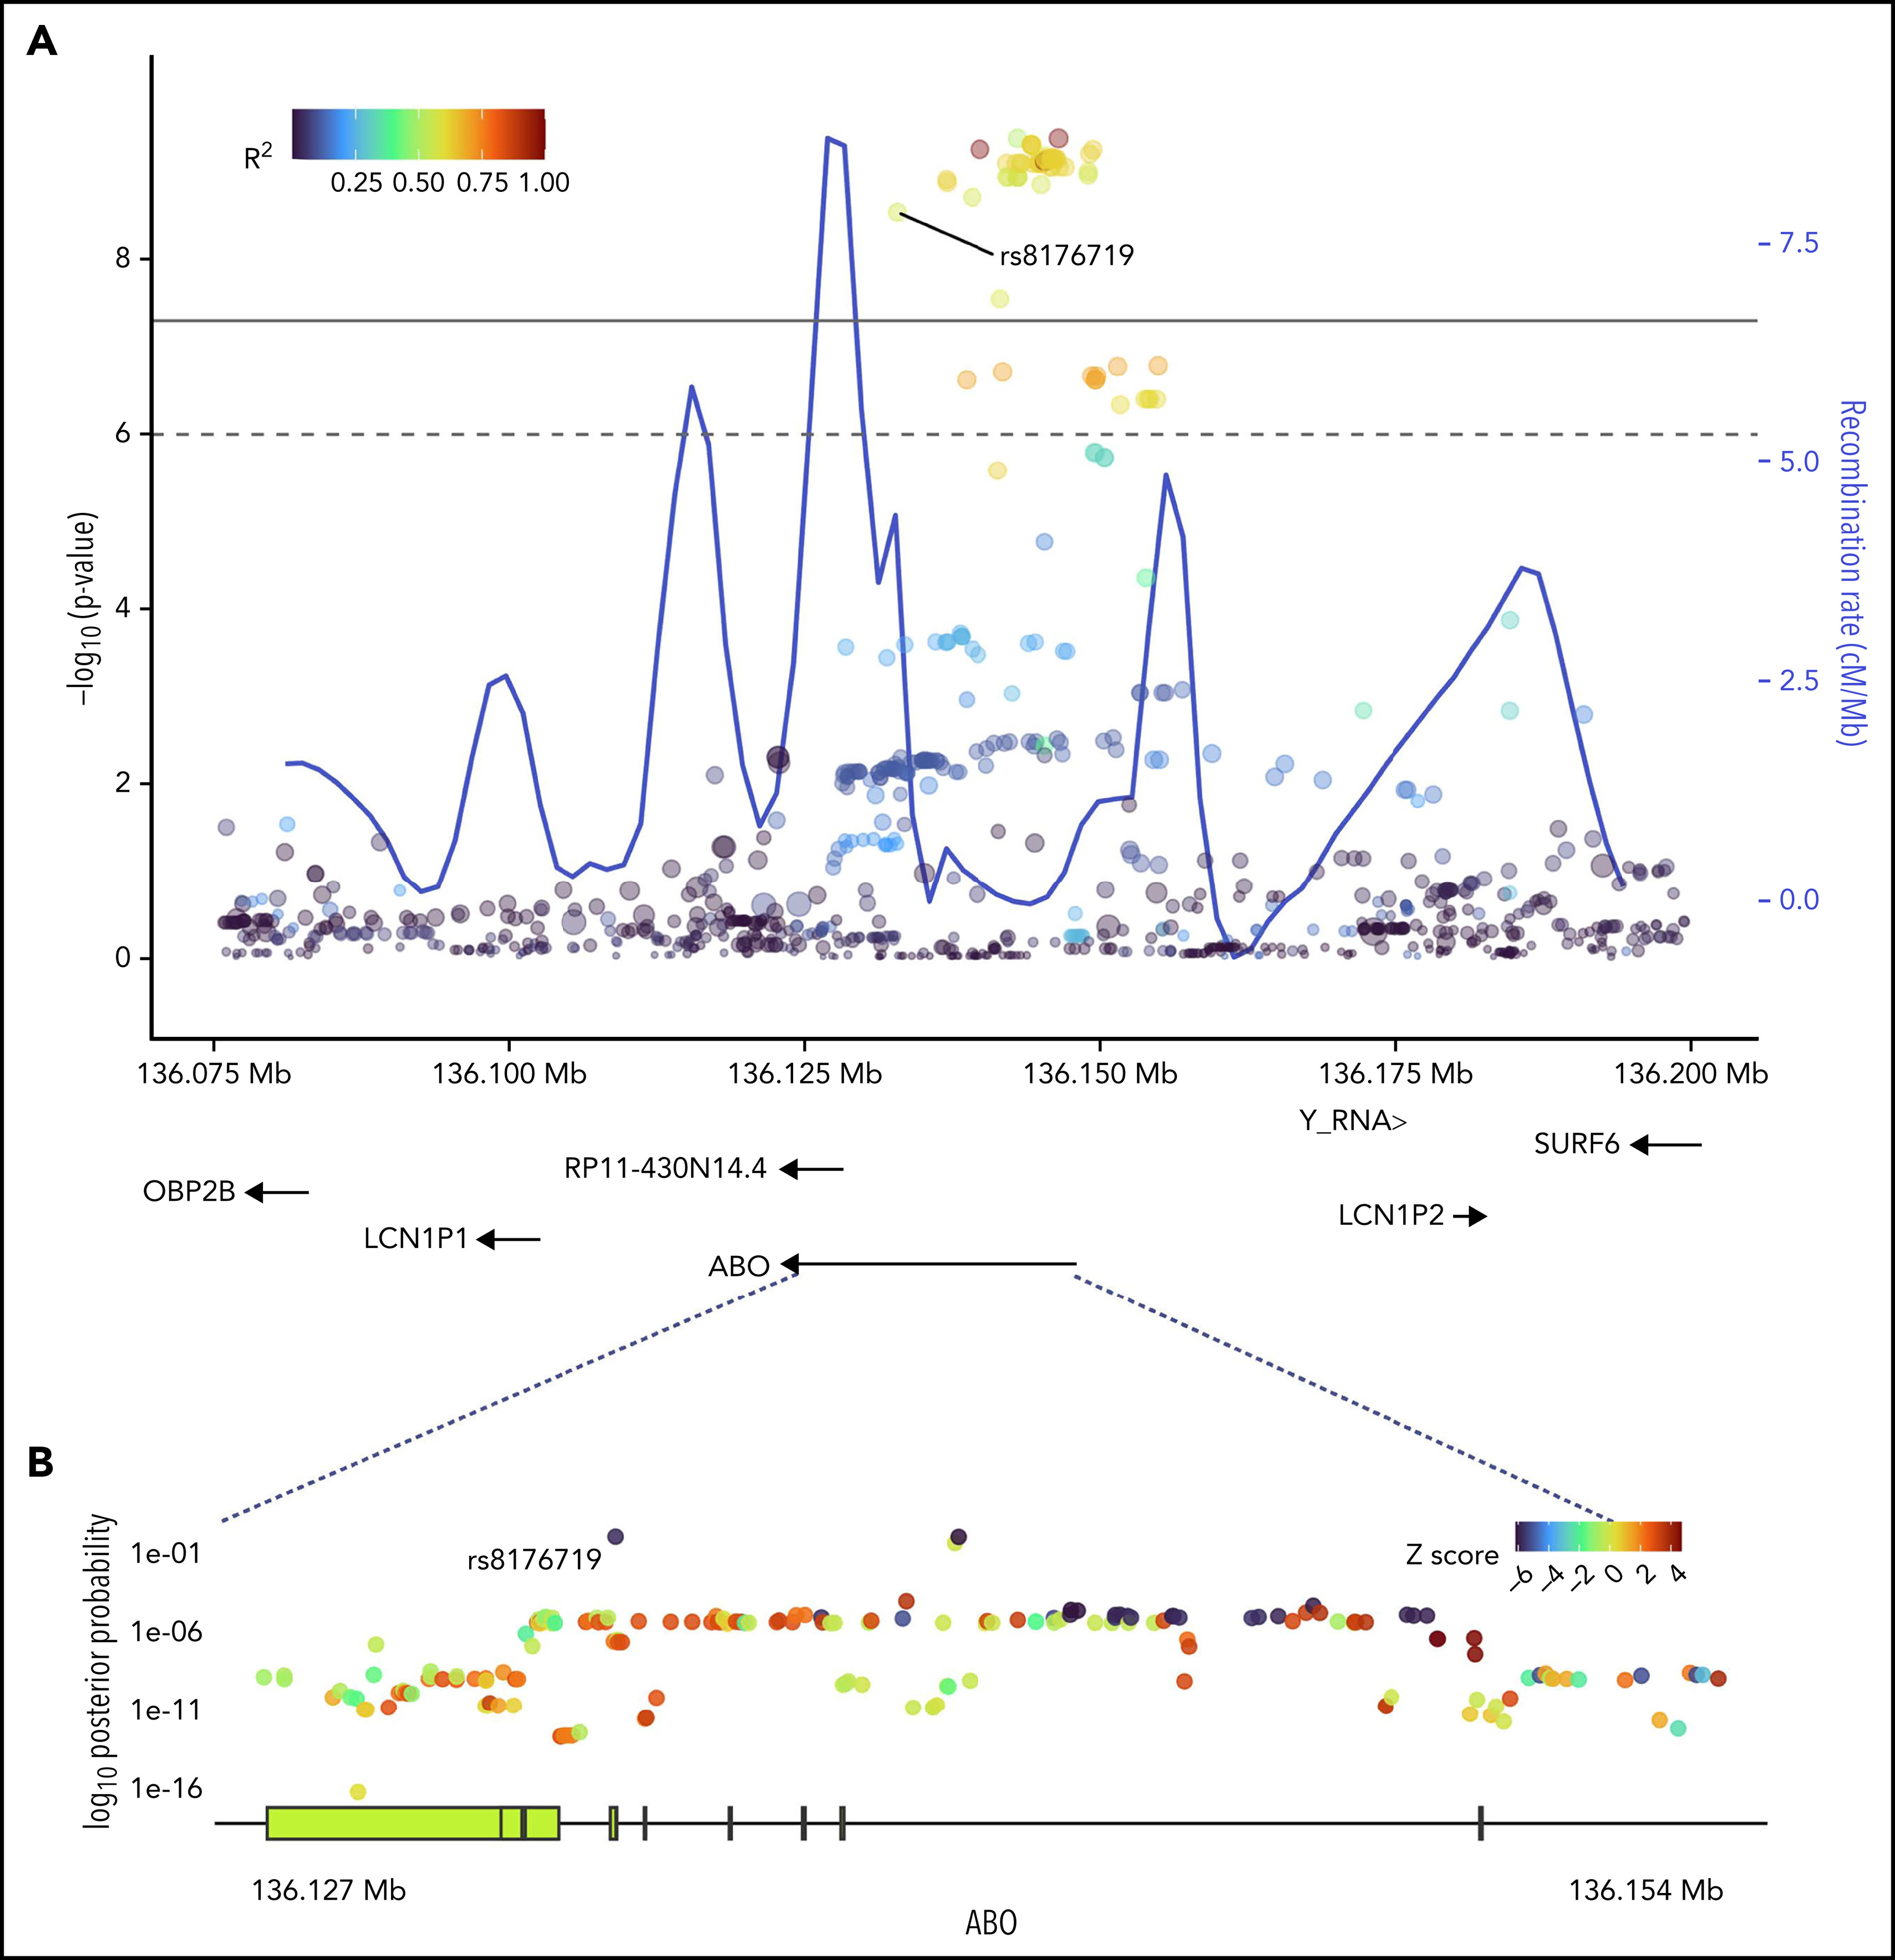
SNPs in ABO and the surrounding region that were most strongly associated with positive functional assay status from (A) meta-analysis of association with functional assay-positive status and (B) fine-mapping of association in PAINTOR. (A) P values were generated using a random-effects meta-analysis of logistic regressions adjusted for age, sex, and principal components 1-3 in an additive model for combined discovery and replication cohorts. P values on the −log10 scale are plotted on the left vertical axis, and the chromosomal position is plotted along the horizontal axis along with the gene names and size of flanking region. The significance threshold of 5 × 10⁻⁸ is indicated by the black horizontal line. Pairwise LD (r2) with this SNP is indicated by dot color as described in the legend in the upper left corner. The right vertical axis indicates the regional recombination rate (cM/Mb), which is overlaid in blue. (B) PAINTOR posterior probabilities based on the association of sequenced ABO SNPs in combined discovery and replication cohorts with functional annotations from FANTOM5, GENCODE, and Transcription Factor Binding Site datasets. Posterior probabilities values on the log10 scale are plotted on the left vertical axis, and the chromosomal position is plotted along the horizontal axis along with ABO exonic/intronic regions. Z Scores for association with functional assay-positive status are indicated by dot color as described in the legend in the upper right corner.
Heidi E. Steiner
Senior Clinical Data Scientist
I love coding in R, biostatistics, and reproducible clinical research.