In My Clinical Trials Era
Check my linkedIn for updates on my career path. tldr; I accepted a position with Boehringer Ingelheim Pharmacueticals and now work as a clinical trial statistician - aka all my career goals have come true.

Local Ancestry‐Informed Candidate Pathway Analysis of Warfarin Stable Dose in Latino Populations
So excited to see this publication finally come out. This was my first project I worked on with the Karnes Lab and I really think it became a diamond from the rough.
Rstudio::conf(2022)
RStudio Conference Experience from a First Time Attendee tl;dr rstudio:::conf is SO FUN! Workshops are aimed at neurotypical learners and everything is available later so go to the talks of speakers you admire.

Everything has Changed
Some updates since you last saw me I am now a Data Science Educator with the Data Science Institute here at UArizona! 🎉 I have learned an immense amount of data science since starting this position, but even more rewardingly, I have learned the joy of teaching!
UArizona Libraries Data Visualization Challenge
🎶Omigod! Omigod you guys Looks like Dizz has gone and won the prize If there ever was a perfect plot then this one qualifies Omigod you guys!🎶
Look at this!
ASCPT Presidential Trainee 2021
I’ve been MIA! Grad school is exhausting! Alas, it’s summer 2021 and I’m back to update my site with some w’s!
American Society of Clinical Pharmacology and Therapeutics Annual Meeting I presented my work on warfarin stable dose prediction in a diverse population featuring a large proportion of Hispanic/Latino reporting warfarin users at the ASCPT 2021 Annual Meeting (,virtually).
PGRN Annual Meeting 2020
Pharmacogenomics Global Research Network (Actually this name is brand new, like yesterday. So in October, when this meeting occurred, the PGRN was still the PharmacoGenomics Research Network).
I presented a poster at the PGRN Annual Meeting in October 2020.
European Energy Data
For this week’s #TidyTuesday data (European Energy) I made a bunch of plots and used cowplot to format them as one figure.
I had a lot of fun trying to make the plots look like the data it was plotting.
TidyTuesday Week 31 (My Week 1!)
#TidyTuesday TidyTuesday, as I understand it, is a weekly challenge to improve upon your R coding abilities. The data is always freely available and the community is always supportive. See this tweet from the FOUNDER of TidyTuesday on my post (and the super easy code to embed a tweet in your website thanks to tweetrmd and webshot2) –>
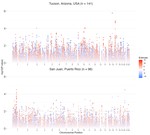
Self-Annotating Manhattan Plots
Significance Skyline with Manhattan Plots Manhattan plots are a type of scatter plot that show the statistical significance of a genomic variant with an outcome of interest. Yan Holtz made a self-annotating manhattan plot for the R Graph Gallery.